Demography Unplugged

Demography Unplugged

Share this post

Demography Unplugged
Chart of the Week: Fertility vs. Trump Vote
NewsWire

Chart of the Week: Fertility vs. Trump Vote

Demography Unplugged's avatar
Demography Unplugged
Nov 26, 2024
∙ Paid
18

Share this post

Demography Unplugged
Chart of the Week: Fertility vs. Trump Vote
3
Share
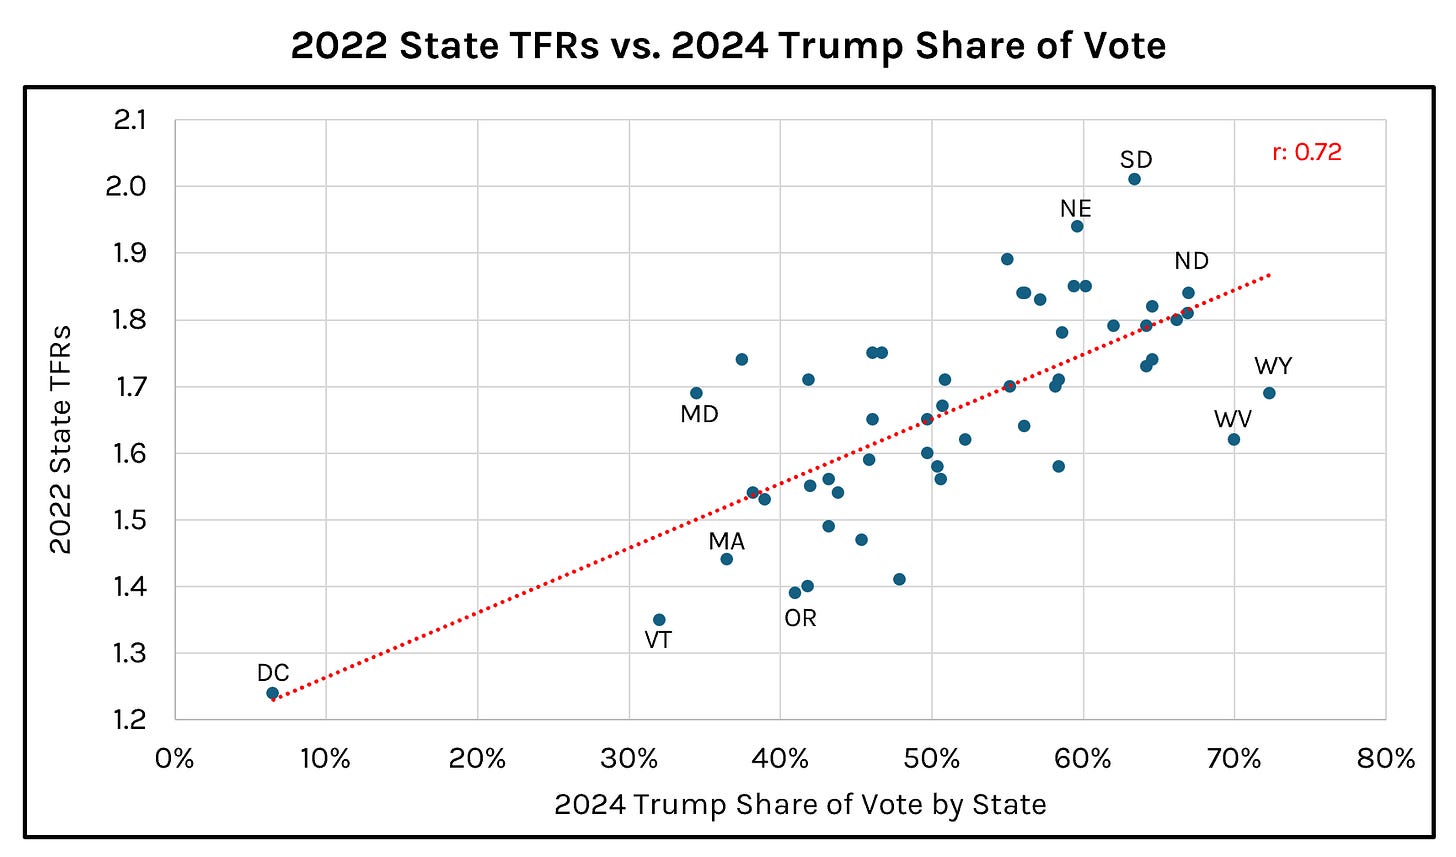
Source: CDC; AP; Hedgeye

In the 2024 presidential election, there was a strong relationship between a state’s total fertility rate and the share of voters who supported Trump, with a correlation coefficient of 0.72. In other words, the Trumpier the state, the higher the fertility. (Note: The most recent data for state TFRs is from 2022.)

The average TFR f…

This post is for paid subscribers

Already a paid subscriber? Sign in
© 2025 Hedgeye Risk Management, LLC
Substack's Privacy, Terms and Information Collection Notice
Demography Unplugged's Privacy and Terms
Start writingGet the app
Substack is the home for great culture

Share