


Student test scores continue to drop. The latest NAEP assessments show 8th graders sliding in science, while 12th graders are hitting new lows in reading and math.
—WSJ
America’s classrooms just delivered more bad news. The 2024 NAEP assessments reveal that 8th graders are falling behind in science, while 12th graders continue to lose ground in reading and math.
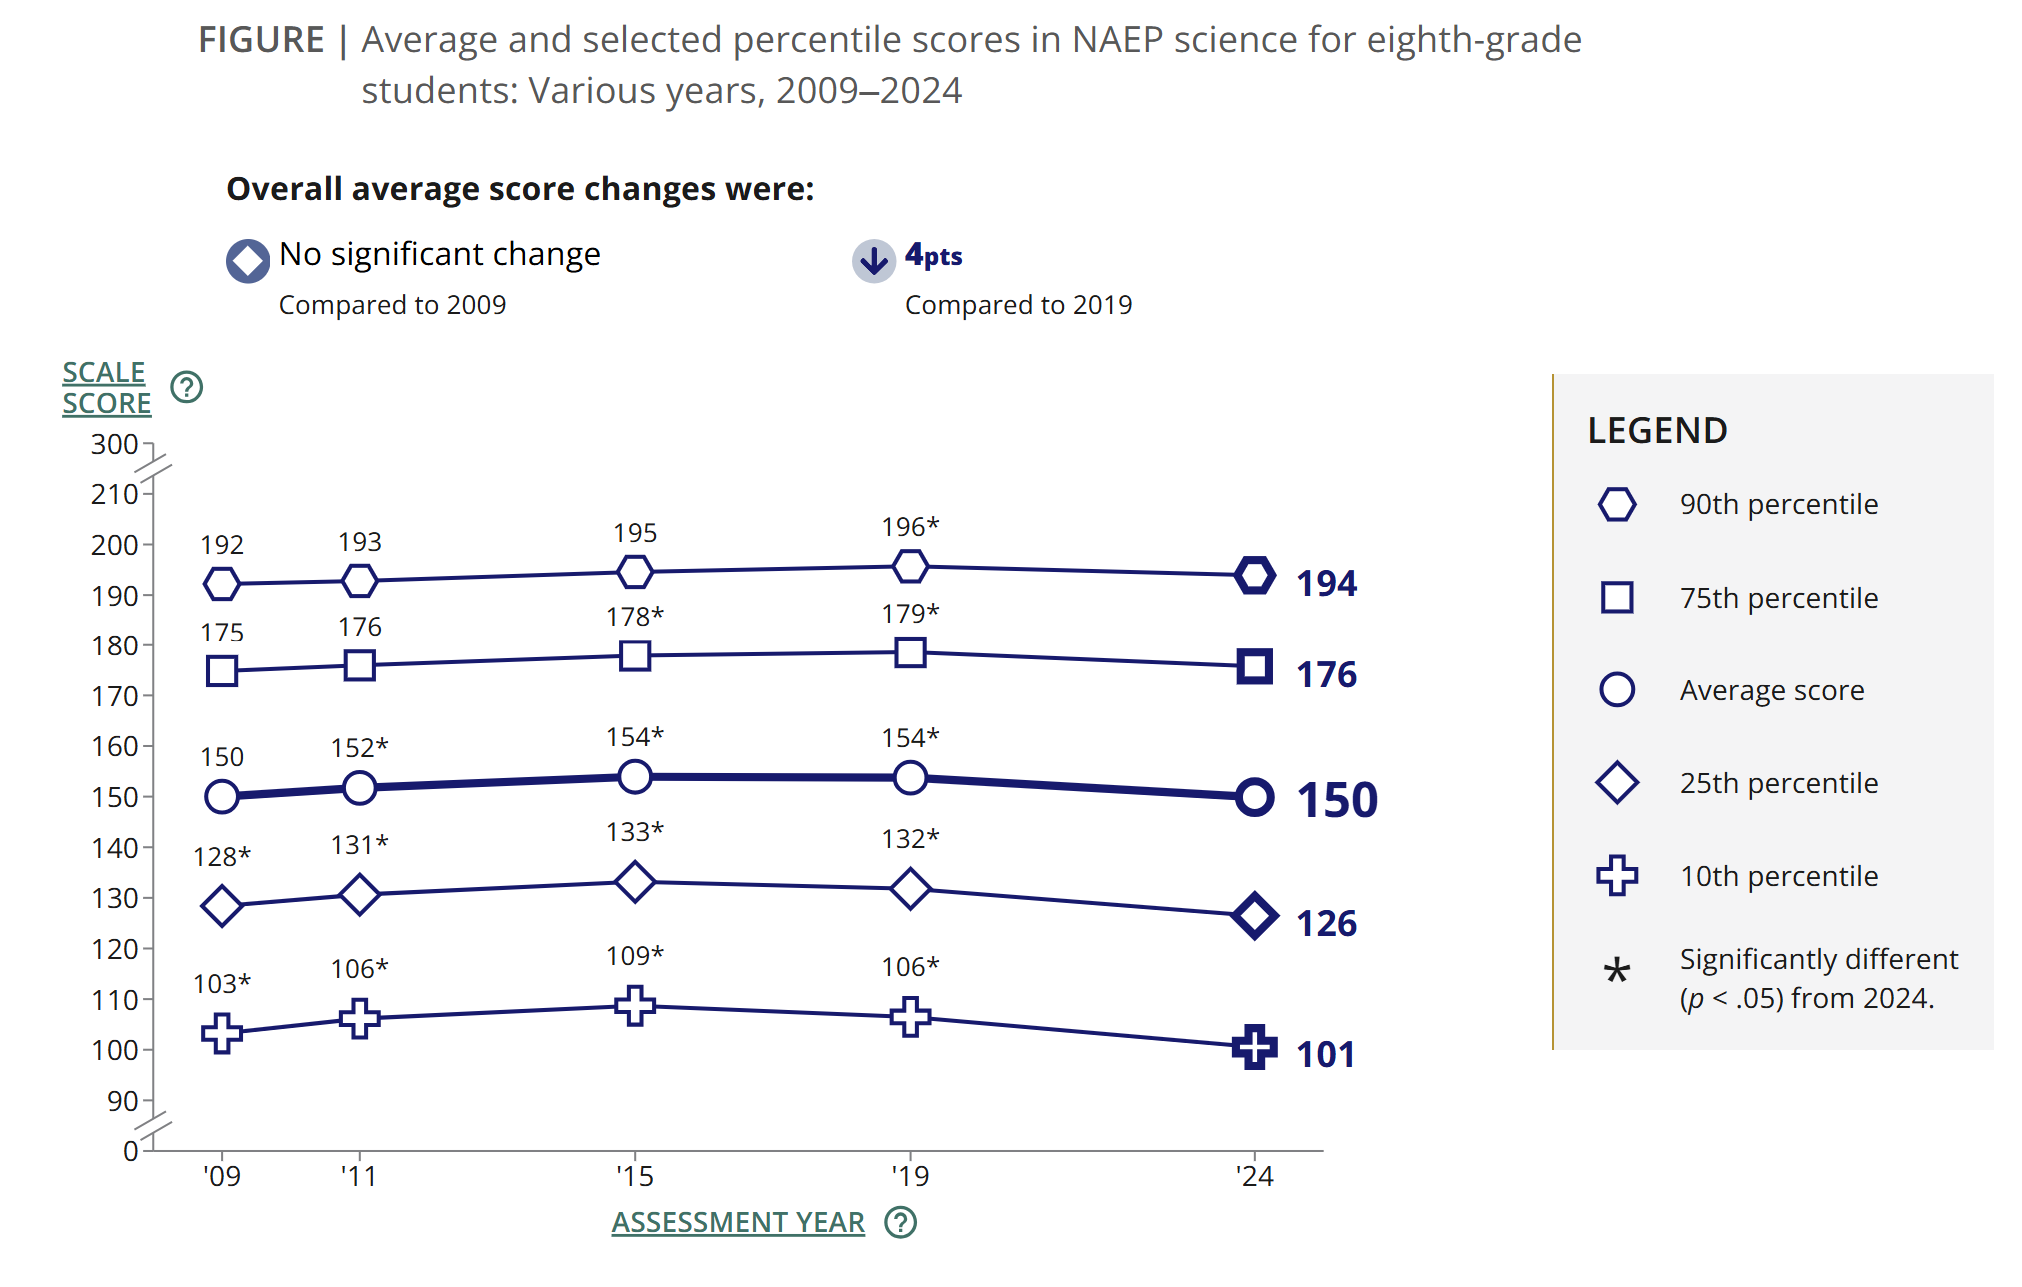
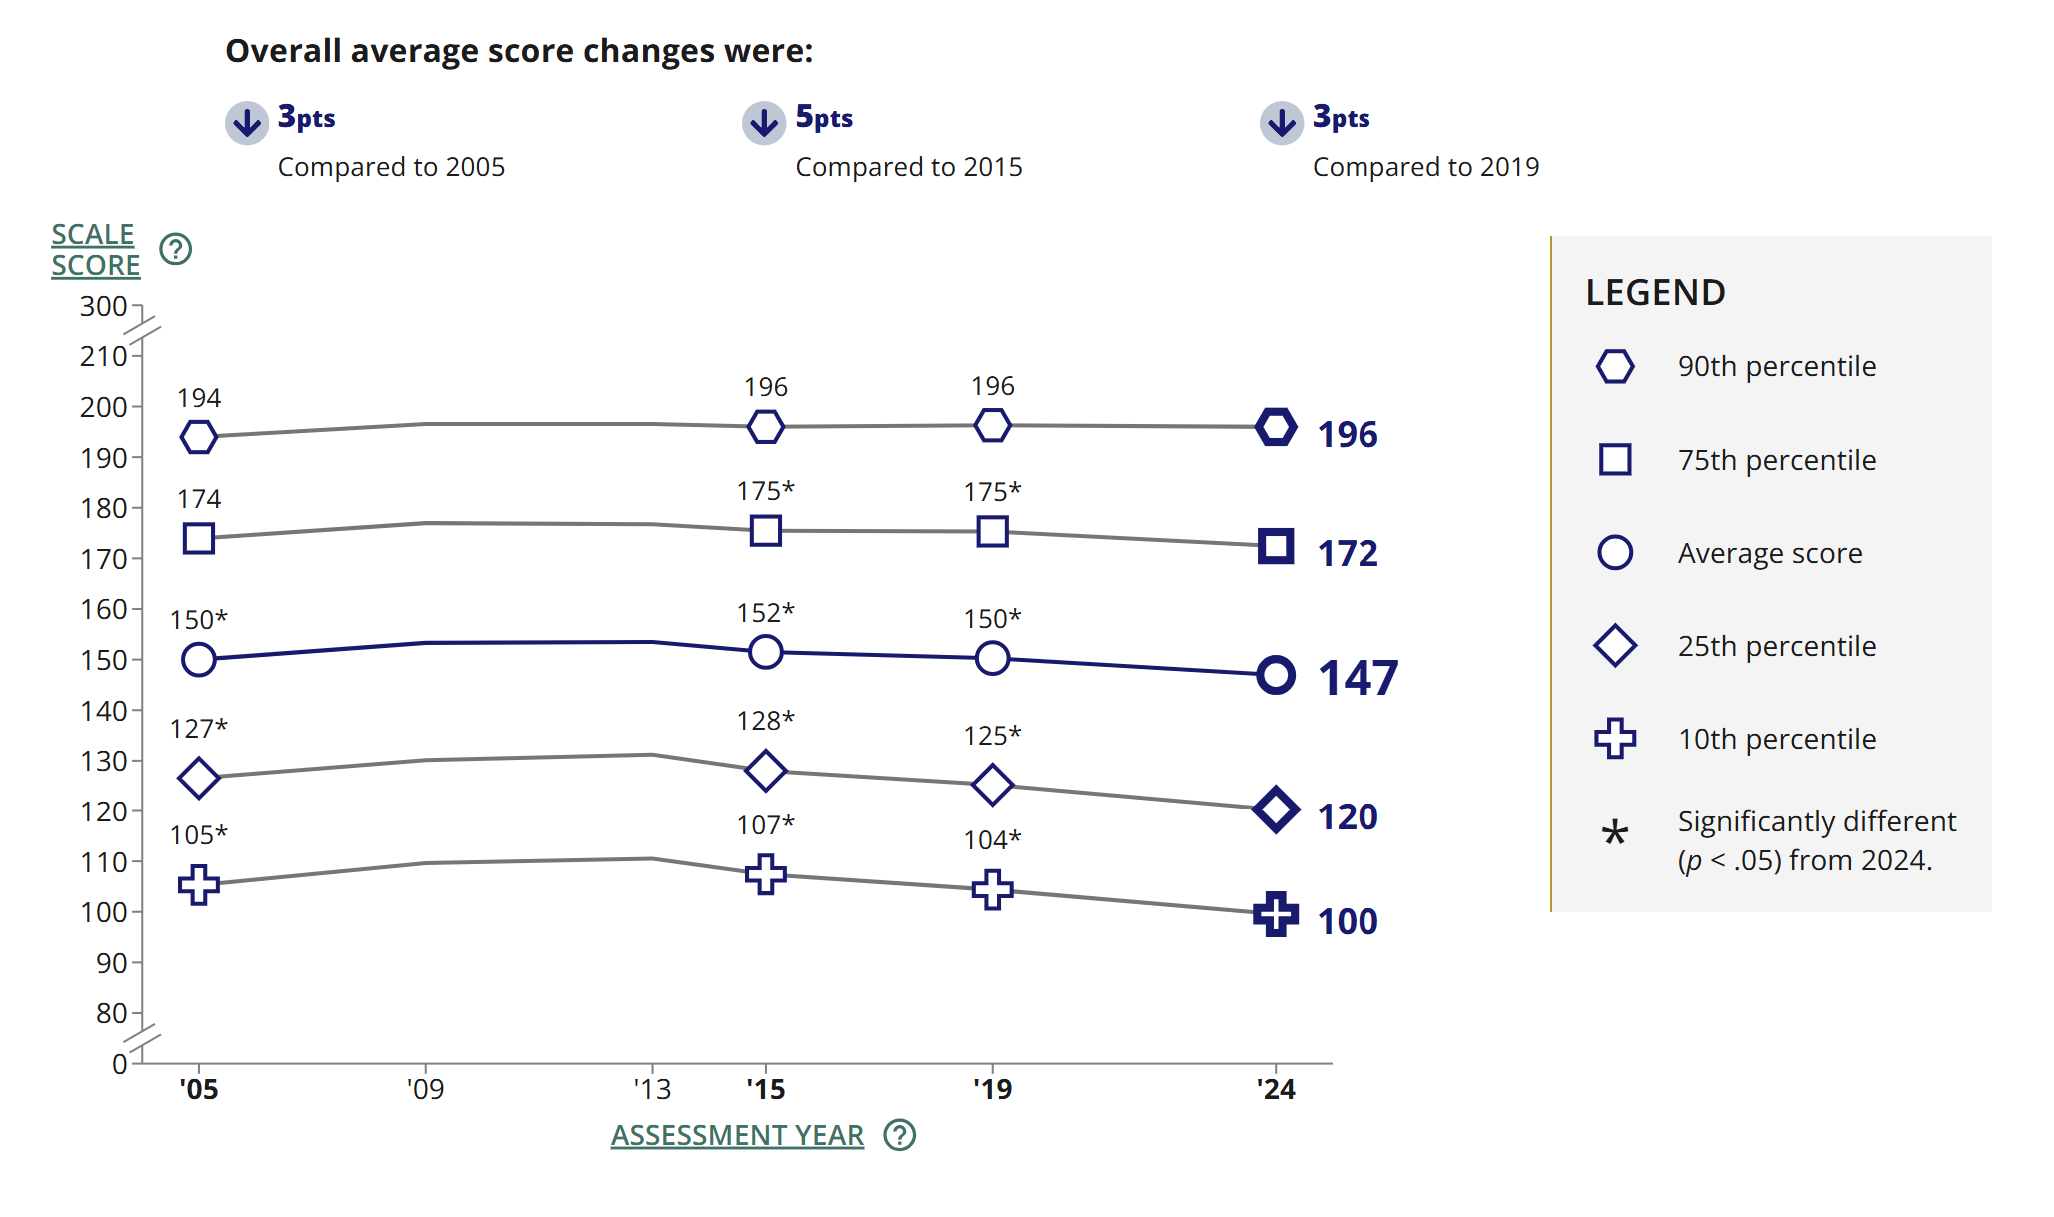
Bottom line? From 2019 to 2024, the share of all 8th graders deemed “proficient” in science dropped from 35% to 31%. Among 12th graders, the share deemed proficient in math dropped from 24% to 22%; and the share deemed proficient in reading dropped from 37% to 35%.
Let’s look first at 8th-grade science scores. In 2024, the average score fell to 150. That’s -4 points below the all-time high reached in 2019. And it marks zero progress from when the test was first administered in 2009.
We are also seeing, since 2019, a rising spread in the distribution of scores. Among 8th graders who scored at the 90th percentile, scores have sunk by only -1% since 2019 and are still close to all-time highs. By contrast, students who scored at the 25th and 10th percentiles are at record lows—and are roughly -5% below where they were in 2019. We saw this same expanding distribution in the reading and math scores released in February. (See “Post-Pandemic Fall in K-12 Achievement.”)
Now let’s move on to high school seniors. The average math score hit a new low of 147. That’s -5 points below the record high reached in 2015, and -3 points below the first test administered in 2005.
Twelfth-grade reading scores? These look even worse. Here we have a longer track record of comparable testing, going back to 1992. And over these 32 years, the general trend in the average score has been downward. In 2024 the average score hit an all-time low of 283. That’s -9 points below the all-time high reached in 1992, the first year this test was administered.
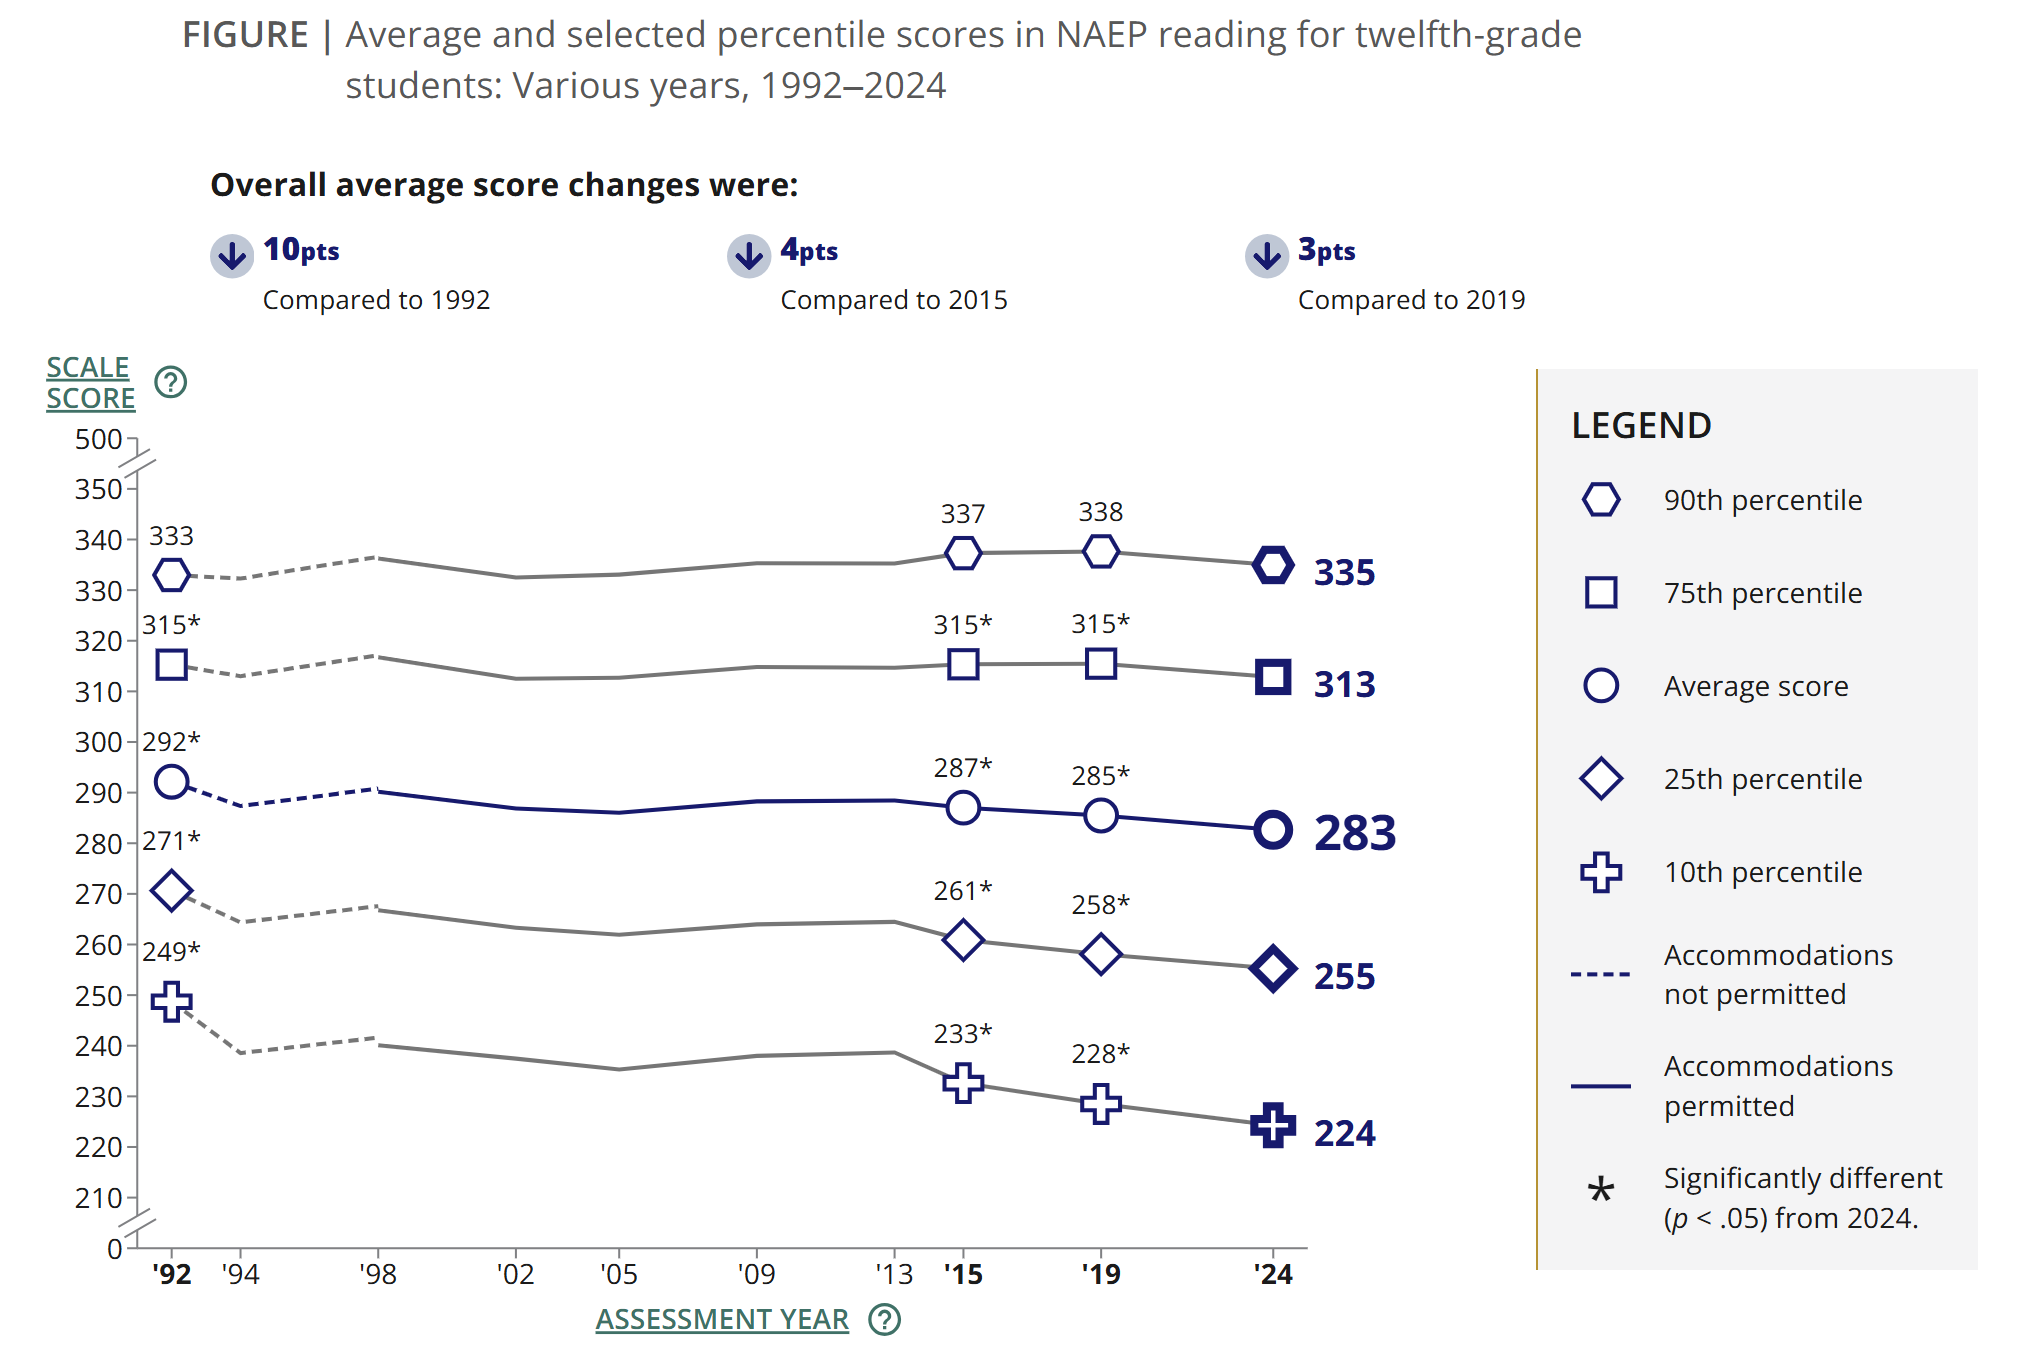
In both the senior math and the senior reading scores, again, we also see a spreading distribution of scores over time—especially over the last few years. The best students remain at or near record highs, while the worst students continue to decline. Consider reading scores since 1992, for example. The best students are still scoring +0.6% higher in 2024 than in 1992; the worst students are scoring -10.0% lower.
What’s behind this decline in achievement?
Since 2015, one major factor is chronic absenteeism, which surged very steeply during the pandemic lockdowns and still remains much higher than it used to be. (See “K-12 Truancy Rates Soar.”) In 2024, 31% of 12th-grade test-takers reported missing three or more days of school in the month before the exam, up from 25% five years earlier. Unsurprisingly, students with the highest absenteeism rates (and the highest growth in absenteeism rates) were heavily concentrated in the lowest quintile of test-takers.
The list of longer-term drivers is long and familiar. Rising screen time and shortened attention spans. Fewer kids reading for pleasure. (See “Fewer Kids Are Reading for Fun.”) Less student engagement with the curriculum, which is perceived as less interesting—and less relevant to kids’ future lives. Declining classroom focus on academic achievement. And declining parental insistence on students meeting whatever classroom achievement (and behavioral) standards remain. Care to add to this list? I’m sure you could, without much difficulty.
Meanwhile, parental time spent with children has actually been rising over the last thirty years, especially time spent on educational activities. But this may be the positive exception that proves the negative rule, since most of the rise in parental time is concentrated among the most educated and highest-earning families. And these no doubt are the students who, as we have just seen, have been least affected by the sinking average.
In case you’re interested, the NAEP conducts a long-term or “trend” comparison of math and reading scores that includes earlier scores going back all the way to 1971. For 12th graders, this long-term assessment hasn’t been updated since 2012. But that hardly matters. One quick look at the achievement trends from 1971 to 2012 reveals virtually no improvement over time. And the likely deterioration since 2012 leads to the sobering inference that the typical kid in the typical school may be somewhat less proficient in reading and math than he or she was 53 years ago. And the typical disadvantaged kid may be significantly less proficient.
This is more than just a sign that kids today are under a lot of stress. It’s a sign that our public educational system is simply not delivering. There has to be a better way.