


In 2024, student test scores revealed a troubling trend: Reading proficiency saw a sharp decline, while math scores showed modest gains but remained well below pre-pandemic levels.
—NAEP
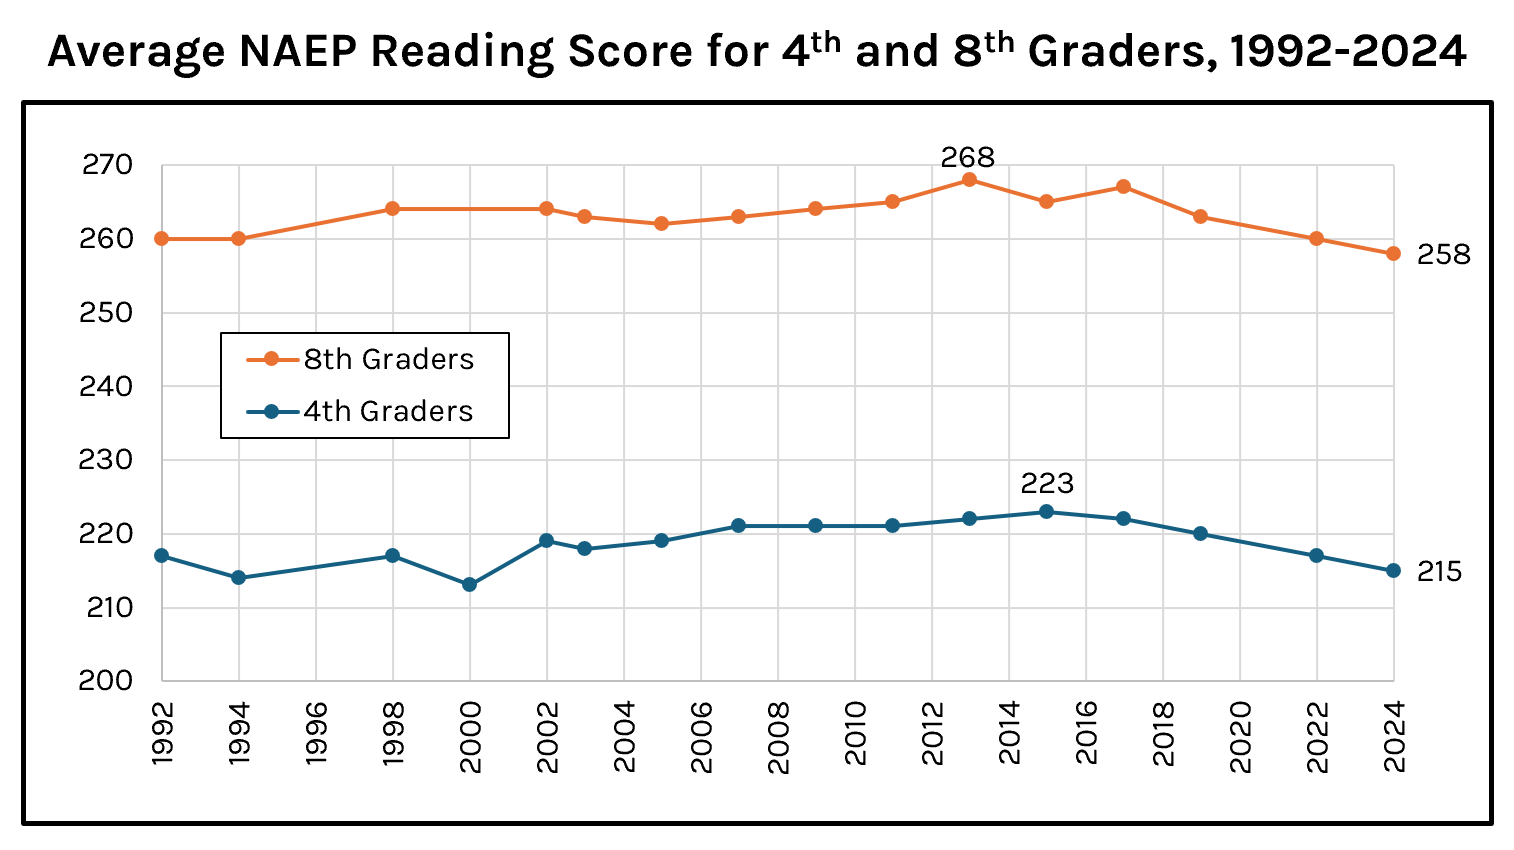
Every two years, the National Assessment of Educational Progress (NAEP) evaluates a broad sample of 4th and 8th graders in reading and math. The 2024 results reveal startling setbacks, particularly in reading. So let’s take a closer look at the data.
Reading scores sharply declined for both grade levels. 4th graders recorded a -2 point decline since 2022 and an -8 point decline since the record high set in 2015. 8th graders also recorded a -2 point decline since 2022 and a whopping -10 point decline since the record high set in 2013.
In 2024, 40% of 4th graders performed below “basic” reading comprehension, a rise of +3 pp since 2022 and +6 pp since 2019. 8th graders recorded a similar trend: 33% performed below “basic” comprehension, a rise of +3 pp since 2022 and +6 pp since 2019.
Math scores were slightly better but still subpar. 4th graders recorded a +1 point increase since 2022. Nevertheless, the score is still -4 points below 2019. 8th graders recorded no change since 2022. Their score is still down -8 points since 2019.

The NAEP also conducts a long-term trend (LTT) assessment every four years. The 2023 results showed that 13-year-old reading scores were only +1 point above the 1971 results, when NAEP fielded its first test. In other words, declining reading scores over the last decade have erased virtually all improvements in the average national score over the prior four decades. That’s despite a 3X rise in inflation-adjusted public spending per K-12 student over those fifty years.
But it gets worse.