According to new Census estimates, the U.S. population grew just 0.4% in the past year. Most of the growth was due to net international migration.
The U.S. population grew by 0.38% from mid-2021 to mid-2022. That’s a slight increase from last year’s record-low growth rate of 0.12%. Yet this year’s number is still very low: It counts as the lowest growth rate ever except for last year. BTW, the Census Bureau traditionally counts its “annual” population as a mid-year number, dated as of July 1 of each year.
When we last discussed population trends (See “U.S. Population Growth Nearly Comes to a Stand Still”), we predicted that the 2021-22 growth rate would be a YoY rise primarily due to increased immigration. And that’s precisely what happened. Net immigration nearly tripled to 1.01M people and was responsible for 86% of the increase in population growth. This reflects looser borders from the depths of pandemic lockdowns, handcuffed enforcement of immigration laws, and rising migration flows from failed states in the western hemisphere. (See “Cuba at the Forefront of a Resurgent Immigration Wave.”)
Natural increase (births minus deaths) rose by +100K to 245K and was responsible for only 14% of total U.S. population growth. Despite the rise in births (see “For the First Time in Seven Years, the U.S. Birthrate Increased”), deaths were still high from Covid-19. (See “U.S. Life Expectancy Declines.”)
Across the nation, 18 states, as well as Washington, D.C., saw their population shrink. This is up from 17 population losers in 2020-21, 16 in 2019-20, and 14 in 2018-19. The decliners were led by New York (-180K), California (-114K), and Illinois (-104K). These declines mostly reflect out-migration driven by Americans seeking affordability. These declining states tend to have the highest prices and tax rates; relatively few affordable homes; and host the supercities in which most working-class people can no longer afford to live. (See “Biggest Metros Spawning Greatest Inequality” and “Rising Concern Over Affordable Housing.”)
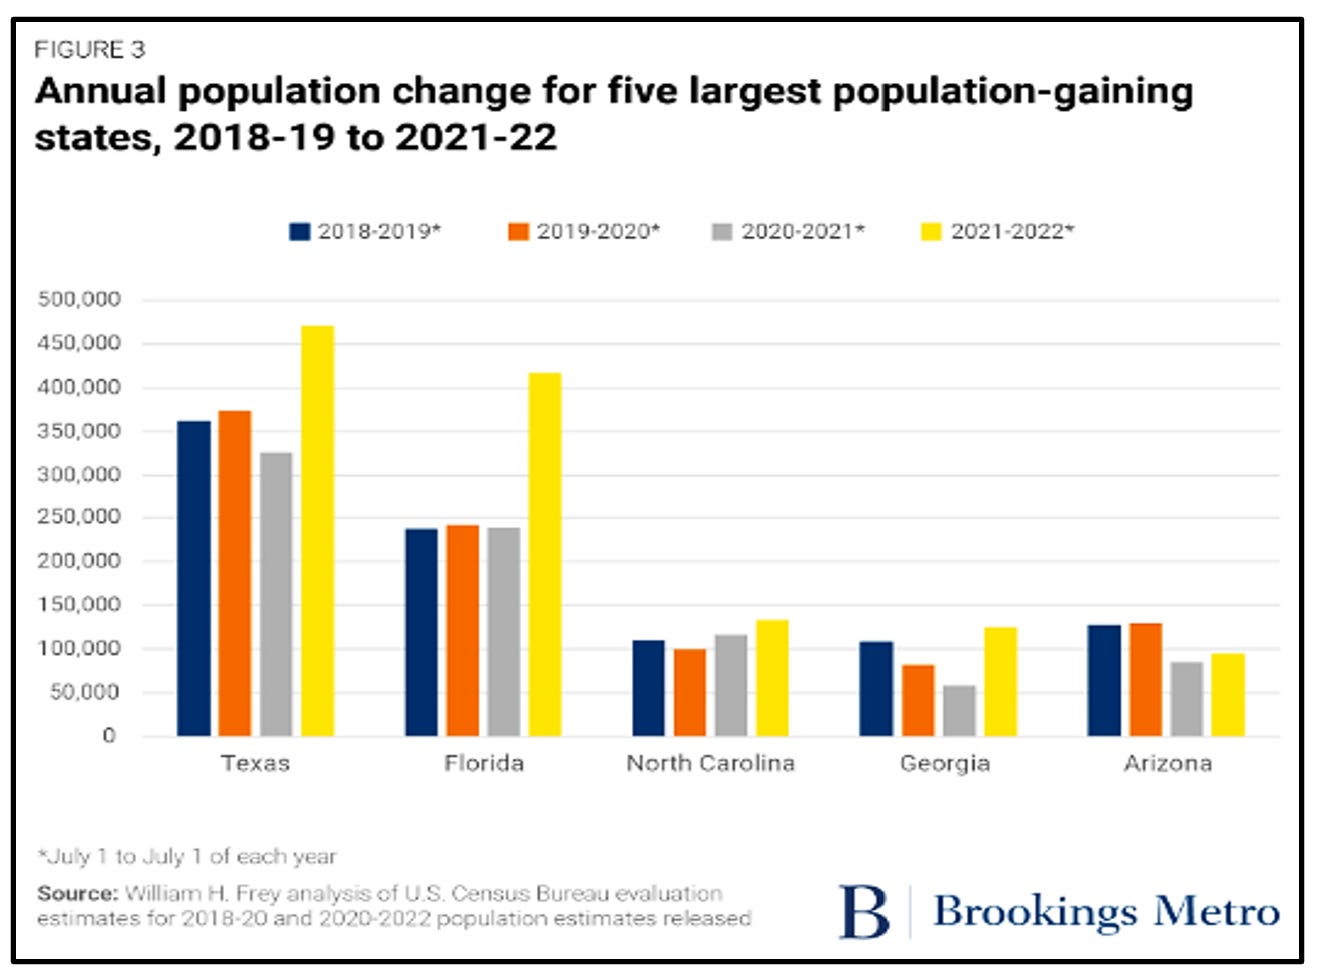
The Sun Belt states, by contrast, had the largest rises. The top five population growers were Texas (+471K), Florida (+417K), North Carolina (+133K), Georgia (+125K), and Arizona (+94K). Moreover, the South was the only region to experience net positive domestic migration for the second year in a row. This area’s popularity is driven mostly by lower living costs—the inverse of what’s driving people out of the depopulating states.
Most of the decliners are still in the Blue Zone, and most of the growers are still in the Red Zone—as measured, e.g., by the presidential party winner in 2020. This continues a long-standing differential in population growth. (See “Why Americans Are Moving to the Red Zone.”) For example, in all of the 10 biggest declining states shown above, the total decline was 424K people, of which 77% (357K) was accounted for by the 5 Blue Zone states. Only 67K was accounted for the 5 Red Zone states.
Yet even these numbers mask the true extent of the Blue-to-Red shift. If we net out immigrants, births, and deaths, and look only at domestic migration within the United States, the imbalance is even more prominent. In the same 10 decliners, the total number of out-migrants was much larger: 948K. And the Blue share was also much larger: 89%. Of all out-migrants from these states, 847K were from Blue states; only 101K were from Red states.
Now let’s return to the total U.S. population outlook. What can we expect for next year? Covid mortality rates are likely to go down. And births and immigration are likely to stay about where they are now. Even if the economy contracts in Q1 of this year, there will be zero impact on births and little impact on immigration before July 1, 2023. Thus we should expect the population growth rate to continue to rise modestly.


